

17 Feb 20
In the four years that it took the Global Lung Function Initiative (GLI) to finish its mission, with the support of six large international respiratory societies, a collaborative network was established that spanned the world.
The network included clinicians, researchers, technicians, IT engineers and manufacturers. The objective was to derive reference equations for spirometry that covered as many ethnic groups as possible, and an age range from pre-school children to old age. This Clinical Insight will guide you to the undestanding of the standard deviation and this NEW method of comparison MEASURED vs PREDICTED in Spirometry: the Z-Score and the LLN.
To define the LLN and the Z-Score is necessary to introduce the concept of standard deviation: "The STANDARD DEVIATION (SD) is a measure of how spread out numbers are from their EXPECTED MEAN VALUE".
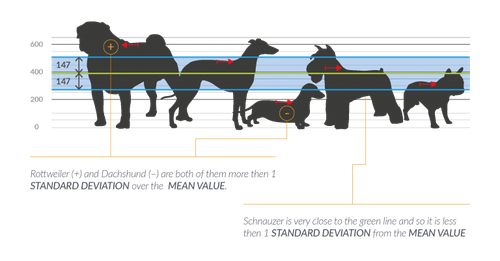
For example in case of dogs, using the STANDARD DEVIATION we have a “standard” way of knowing what is normal (Schnauzer), and what is extra large (Rottweiler) or extra small (Dachshund).

Fig. 1 - The heights of dogs at the shoulders in millimeters.
Normal Distribution and Percentile
When the data tend to be around a central value we have a NORMAL DISTRIBUTION with a bell–shaped curve. Relationship between STANDARD DEVIATION (SD) and percentage of data under the curve in the case of a normal distribution.
When the data tend to be around a central value we have a NORMAL DISTRIBUTION with a bell–shaped curve.
68% of measures are between +1 and –1
STANDARD DEVIATION
90% of measures are between +1.64 and –1.64
STANDARD DEVIATION
Location and meaning of the 5th percentile
The range between the 5th percentile and 95th percentile includes 90% of the population. The 5th percentile (-1.64 STANDARD DEVIATION) is the minimum value of the observed parameter below which is only 5% of the population.
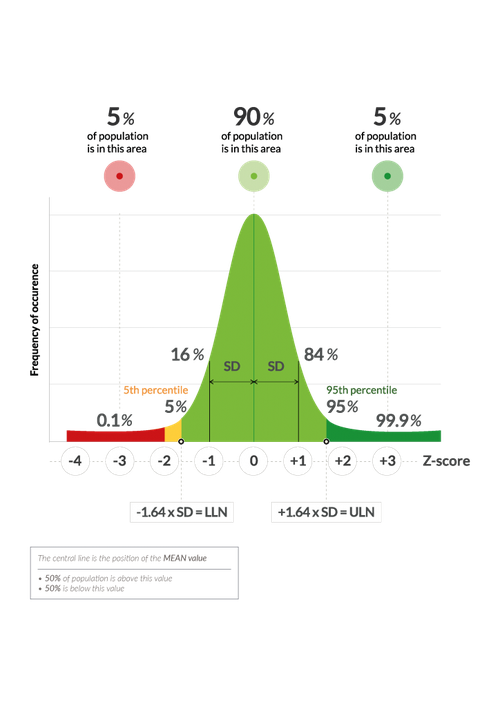
Fig. 2 - Normal Distribution and Percentile.
Predicted LLN and Z-Score
Results of spirometric tests characteristically lead to values for FVC and FEV1 which are too low rather than too high in disease.
This explains why the LLN is defined as that value which identifies the lower 5th percentile of a healthy population of non-smokers.
If a patient has an FEV1 MEASURED = LLN, it means that he is at the limit of the 5th percentile. Only 5% of the healthy population, with his own anthropometric data, has a lower value.
Therefore 5% of the healthy population represents false positives, ie healthy subjects having values below the LLN and then, at first sight, could be considered sicks!
There are two methods of comparison MEASURED vs PREDICTED.
1) CLASSIC: %PREDICTED =
MEASURED / PREDICTED x 100
2) NEW: Z–SCORE =
(MEASURED – PREDICTED) / STANDARD DEVIATION
In the dogs example, for simplifying we assume that the PREDICTED value of the height is equal to the MEAN value.
How to use the Standard Deviation
The heights of the dogs (in mm) are: 600, 470, 170, 430 and 300

MEAN = 394 mm (green line)
STANDARD DEVIATION = 147 mm (blue line)
LLN = MEAN – 1.64 x STANDARD DEVIATION = 394 – 1.64 x 147 = 153
NOTE: the STANDARD DEVIATION is calculated by taking in account the differences between the MEASURED VALUE and the MEAN VALUE for all dogs.
Let’s try to calculate %Predicted and Z-Score
The heights of the dogs (in mm) are: 600, 470, 170, 430 and 300
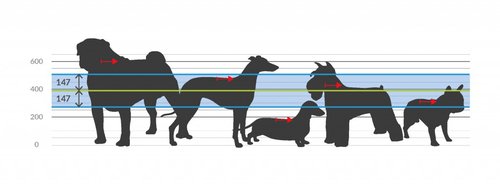
CLASSIC METHOD: %PREDICTED = MEASURED / PREDICTED x 100
Rottweiler 600/394 x 100 = 152% taller then PREDICTED
Dachshund 170/394 x 100 = 43% shorter then PREDICTED
Schnauzer 430/394 x 100 = 109% very close to PREDICTED
It is a very intuitive method and indicates what is the percentage value of the MEASURED VALUE in relation to the PREDICTED VALUE
NEW METHOD: Z–SCORE = (MEASURED – PREDICTED) / STANDARD DEVIATION
Rottweiler (600-394)/147 = +1.40= more then 1 SD taller
Dachshund (170-394)/147 = -1.52= more then 1 SD shorter
Schnauzer (430-394)/147 = +0.24= less then 1 SD taller
This method is less intuitive and indicates how often a measurement is greater (+) or less (-) of the STANDARD DEVIATION.
The benefits of Z-Score
The LLN value can also be expressed as a percentage of the PREDICTED:
1) In a healthy person, 20 years old: LLN of FEV1 = 80% of his PREDICTED
2) In a healthy person, 80 years old: LLN of FEV1 = 66% of his PREDICTED
It is clear that the true LLN, when expressed as %PREDICTED, varies considerably with the age. FEV1 value of 66% of the PREDICTED may be fine in a 80 years old person but it would be abnormal for a 20 years old person!
Therefore evaluate a respiratory disease according to the calculation method% PREDICTED is a very popular but should be replaced by the method of the Z-SCORE.
The benefit is that Z–SCORE is completely independent of age, height and sex.
For example, if the Z–SCORE for any parameter is –1.64, this signifies in males, females, children and adults that the measured value is at the 5th percentile.
In lung function testing this is regarded as the LLN.
Interpretation of Spirometric results
When interpreting test results there is uncertainty about the “abnormality” of a finding near the LLN than if the test result is within the normal range or in a pathological range.
Measured values of FEV1, FVC, FEV1/FVC with additional indices, such as PRE and POST bronchodilator, predicted values, LLN, % of predicted, confuses most users.
Conversely, PICTOGRAMS in which Z–SCORE are depicted relative to a normal range allow a simple interpretation of the spirometric results.
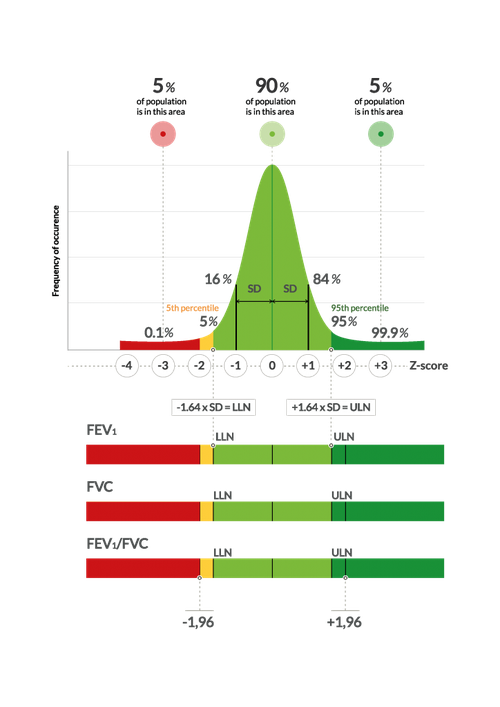
Fig. 3 - Pictograms.
When Z-SCORE is -1.64, it means that the parameter of the spirometry is placed exactly on the LLN that represents the point below which only 5% (5th percentile) of the normal population had a value lower than predicted.
In the center of PICTOGRAM the Z-SCORE is equal to 0, it indicates that the measured value is exactly equal to the predicted one.
In this point we find 50% of the healthy population (the center of the bell).
In conclusion, if a patient has an FEV1 MEASURED = LLN, it means that he is at the limit of the 5th percentile.
Only 5% of the healthy population, with his own anthropometric data, has a lower value. In short, it is still healthy but he is very close to…
…the population considered sick!


PC – based spirometer powered by MIR Spiro Software
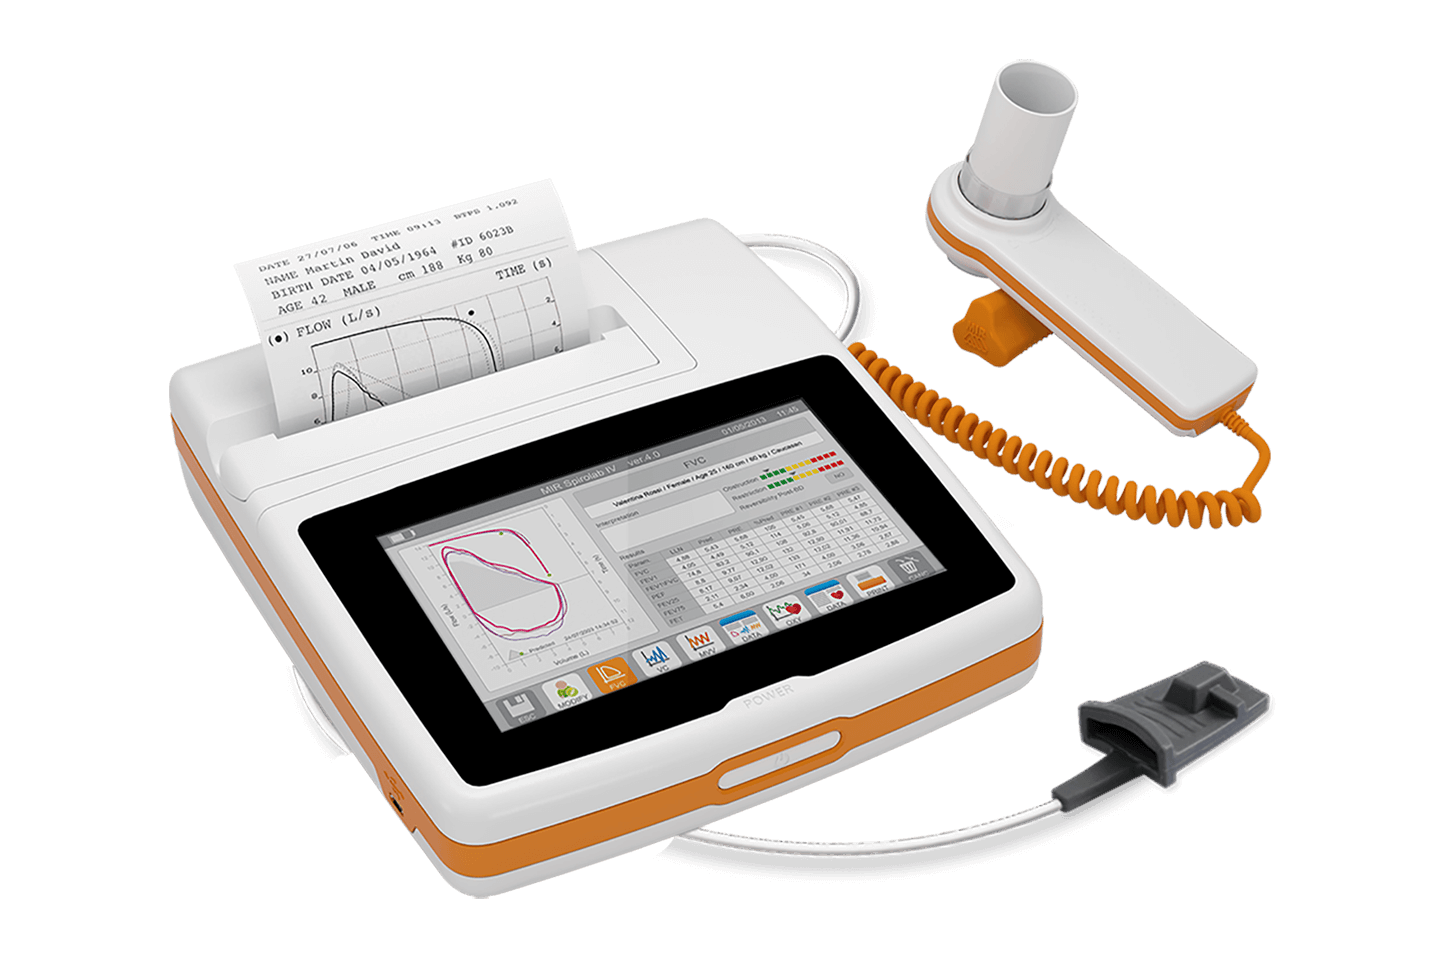
All-in-one desktop spirometer

The evolution of desktop spirometry

Detection of Emphysema by Spirometry


